2. On the seismogram as a "Journey through the interior of the earth"
Both models also demonstrate that the transverse wave (S) takes considerably longer than the longitudinal wave (P) to transmit information.
With the arrival signals of the P and S waves (see fig. 17) one can determine the distance of the station to the quake's epicenter and can thus determine the origin time of the quake.
This subject will be further examined in chapter 6 'On the evaluation of a seismogram'.
The distance D between epicenter and station is measured in degrees of angles. One can measure those angles with an halfcircle ruler, as one can find on any terrestrial globe to ascertain the latitude of any place. For example the distance between Germany and Japan is about 90°. That means - in accordance with the primary definition of the meter - a distance of 10,000 kilometers.
In conclusion to this chapter it should be again pointed out that it is only through earthquake waves that we can discover how the earth is built in its interior. We review fig. 10 again: Richard Dixon Oldham discovered the liquid core of the earth in 1906 and Inge Lehman discovered the solid core, which floats within the center of the liquid core.

Fig.22: Richard Dixon Oldham & Inge Lehman
During precise analyses of seismograms Inge Lehman occasionally found P-waves in the 'shadow-zone' (103° to 142°) , as can be seen in fig. 20a by example of the 'green' body wave "(1)". So it became obvious that the solid core of the earth caused these signals of reflection.
In view of the current possibilities of electronic amplification stronger earthquakes can even be registered in the 'shadow zone'. Therefore we could register the strong seaquake in the Flores - Sea on the 17th June 1996 (magnitude 7) with a distance of D = 112,04° from the epicenter very clearly.
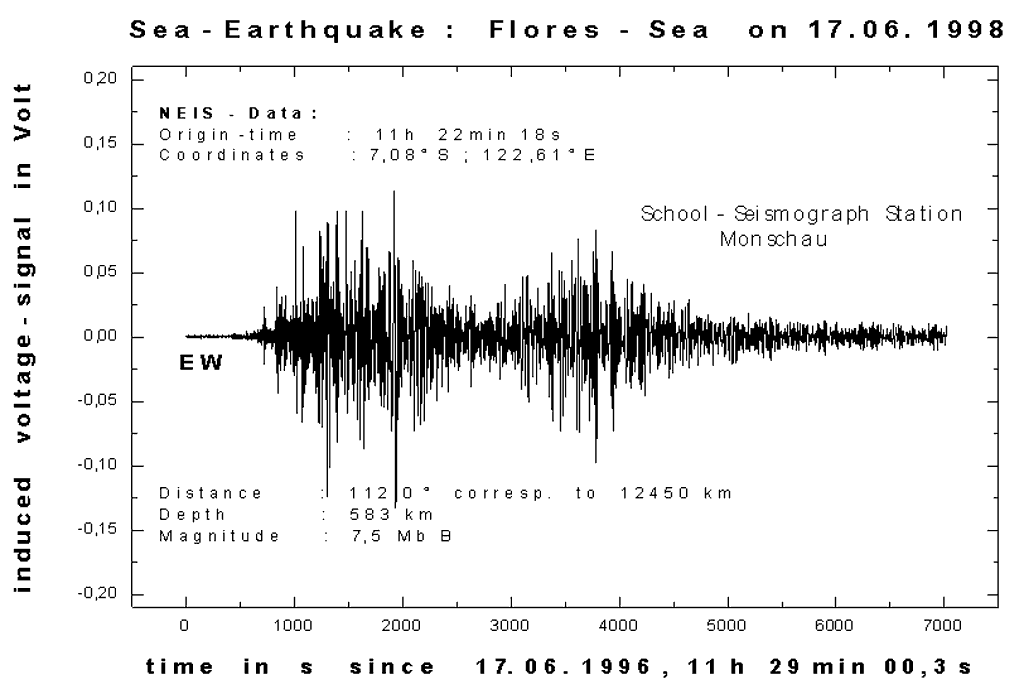
Fig.23: A sea-quake in the Flores-Sea that lies in the shadow zone of Central Europe.
The arrival time of the signals in Monschau according to the running-time table is: 11h 40min. 55sec.
Measured were:
- with the North-South seismograph: 11 h 40 min 55.2 sec
- with the East-West seismograph: 11 h 40 min 53.4 sec
- with the vertical seismograph: 11 h 40 min 58.2 sec
We now want to show the details of a seismogram of an earthquake in the vicinity of the island of Taiwan recorded by the seismograph set in our school.
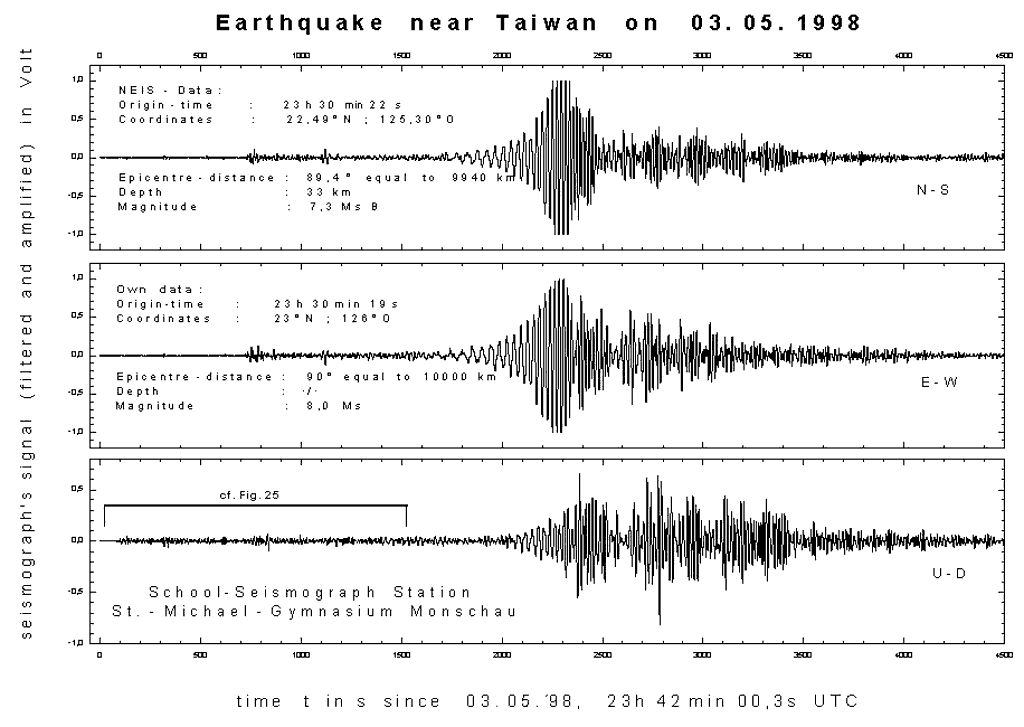
Fig.24: The Taiwan earthquake of 3rd May 1998
The first 1500 seconds of the seismogram appear as follows:
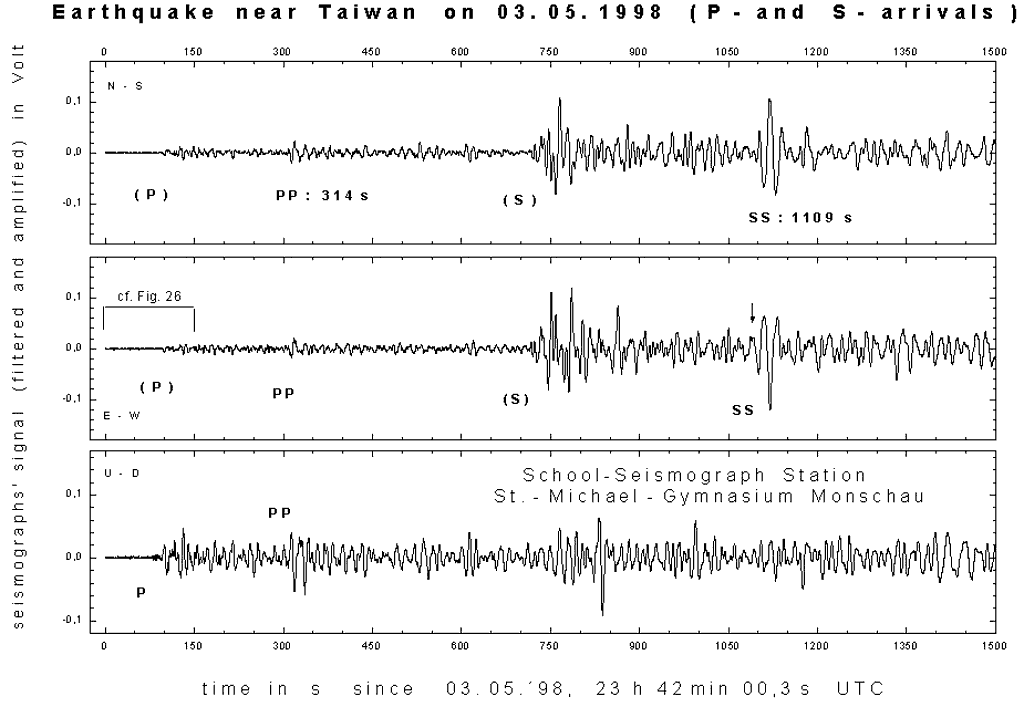
Fig.25: The first 1500 seconds of the Taiwan seismogram.
And our seismograph registered the first 150 seconds as follows:
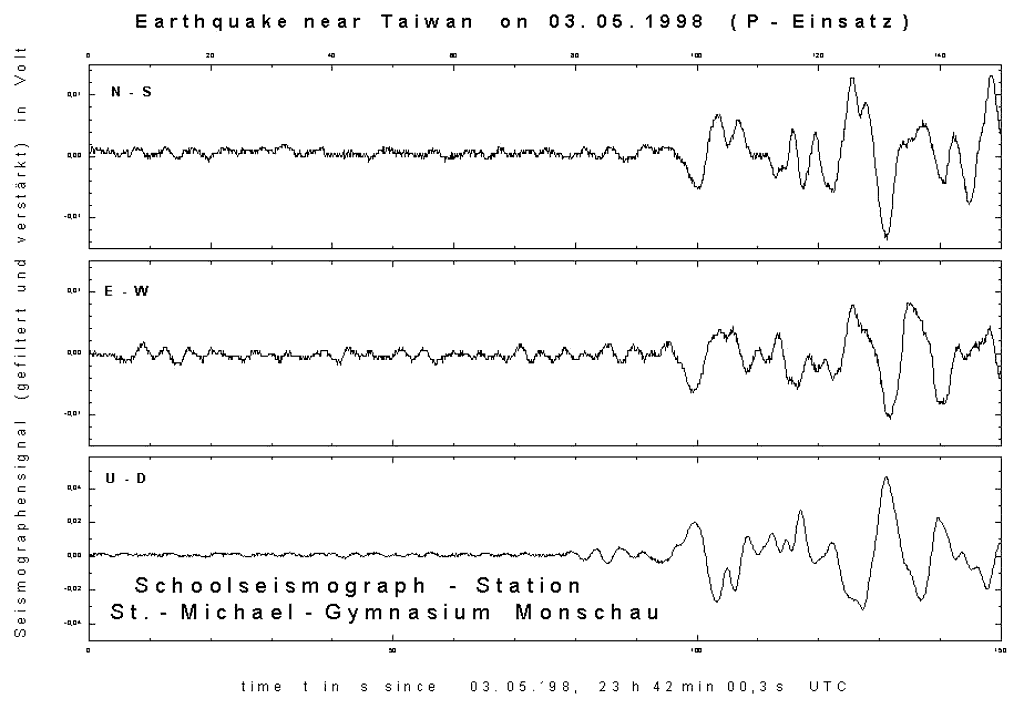
Fig.26: The first 150 seconds of our Taiwan seismogram.